 |
|
The 'CPU Monitor' GUI module is a dedicated CPU monitoring GUI module showing the total CPU usage, user CPU usage, kernel CPU usage, CPU interrupt time, CPU interrupt rate, the current CPU frequency, the C1 low-power state, C2 low-power state and C3 low-power state. The bottom part of the GUI module includes a list of CPUs in the monitored system and all the monitoring counters are showing the monitoring data for the currently selected CPU. In addition, the user is provided with the ability to display the aggregated monitoring data for all CPUs. 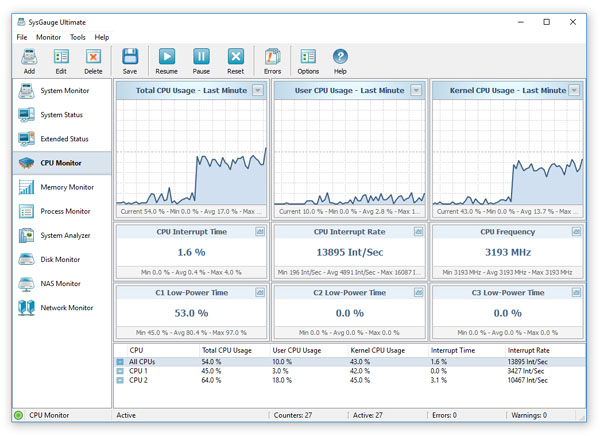
The CPU usage charts located on the top side of the GUI module allow one to display the monitoring data for the last minute, last 2 minutes or last 5 minutes. In addition, the user is provided with the ability to display data charts from all other counters by pressing on the 'Chart' button located in the top-right corner of each counter. 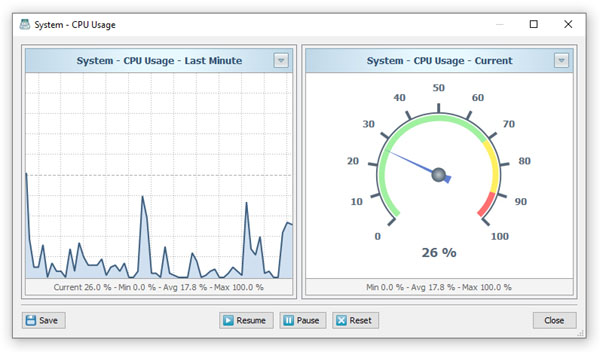
The data chart dialog provides the ability to view the monitoring data for the last minute, last 2 minutes or last 5 minutes. In addition, the user is provided with the ability export the counter's monitoring data, pause, resume and reset the monitor. CPU Monitoring Counters In addition to the dedicated CPU monitor module, the user can use the customizable 'System Monitor' module to configure user-custom CPU monitoring profiles. In order to add a CPU usage counter, press the 'Add' button located on the main toolbar, selected the 'CPU Usage' counters category in the left-side view and then select an appropriate CPU usage counter in the middle view. By default, SysGauge will monitor all CPUs, but if required, the user can select a specific CPU to monitor in the right-side view. In addition, in order to monitor the CPU usage in a remote computer via the network, press the 'Connect' button located in the bottom-left corner and specify the host name of the remote computer to monitor. 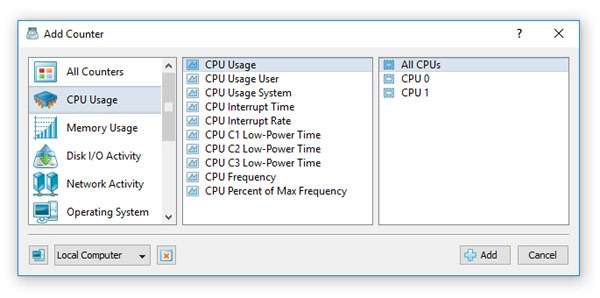
SysGauge Command Line Utility The SysGauge command line utility, which is available in SysGauge Ultimate and SysGauge Server product versions, provides the ability to monitor the CPU usage and save CPU usage monitoring reports from batch files and shell scripts. The command line utility is located in the SysGauge 'bin' directory and it can be used to monitor the local system or remote servers via the network. 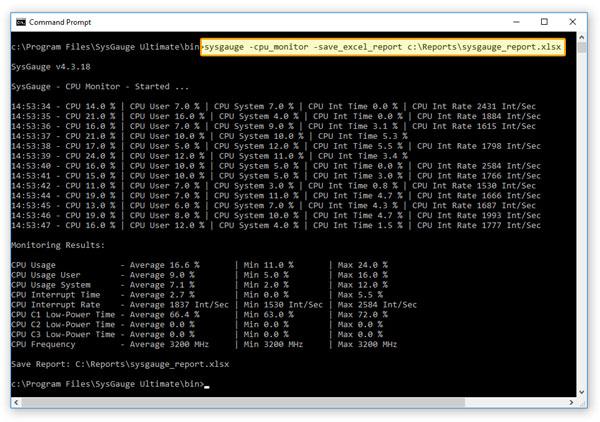
In the simplest case, open a command prompt window, go to the SysGauge 'bin' directory and type the following command: sysgauge -cpu_monitor -save_excel_report <File Name or Directory> This command will perform a CPU usage monitoring operation using a number of CPU monitoring counters including the total CPU usage, the user-level CPU usage, the system-level CPU usage, the CPU interrupt time, the CPU interrupt rate, the C1, C2 and C3 low-power CPU states and the CPU frequency. In addition, after the monitoring operation will be completed, SysGauge will save an Excel CPU usage monitoring report to the specified file or directory. Command Line Options: -extended By default, the CPU usage monitor reports the total CPU usage statistics for all CPUs in the monitored system. This command line option enables individual CPU usage monitoring counters for each CPU and the CPU usage monitoring results will include individual CPU usage statistics for each CPU or CPU core in the monitored system. -host <Remote Host Name or IP address> This option allows one to monitor the CPU usage in remote servers via the network. -time <Monitoring Time in Seconds> This command line option sets the maximum monitoring time. -silent This command line option enables silent operation, which is useful when saving reports. -save_html_report <File Name or Directory> This command line option saves an HTML CPU monitoring report. -save_pdf_report <File Name or Directory> This command line option saves a PDF CPU monitoring report. -save_excel_report <File Name or Directory> This command line option saves an Excel CPU monitoring report. -save_text_report <File Name or Directory> This command line option saves a text CPU monitoring report. -save_csv_report <File Name or Directory> This command line option saves a CSV CPU monitoring report. -save_xml_report <File Name or Directory> This command line option saves an XML CPU monitoring report. -save_to_database <Table Name> This command line option saves monitoring results to the specified SQL database table. 


|
|

