SysGauge Ultimate allows one to monitor one or more Microsoft IIS Servers locally or via the network. In order to add an IIS Server monitor press
the 'Add' button located in the top-left corner of the window and select the 'IIS Server Monitor' menu item. The IIS Server monitor provides
the IIS Server performance tab, the IIS Server statistics tab and allows one to select which web site to monitor.

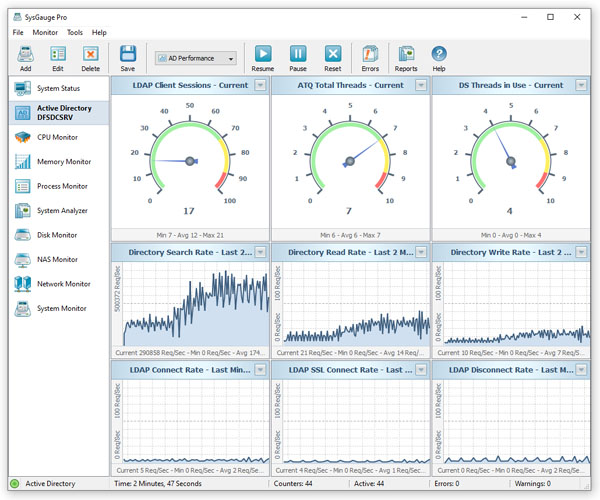
The IIS Server performance tab displays the current number of connections, the number of anonymous users, number of non-anonymous users,
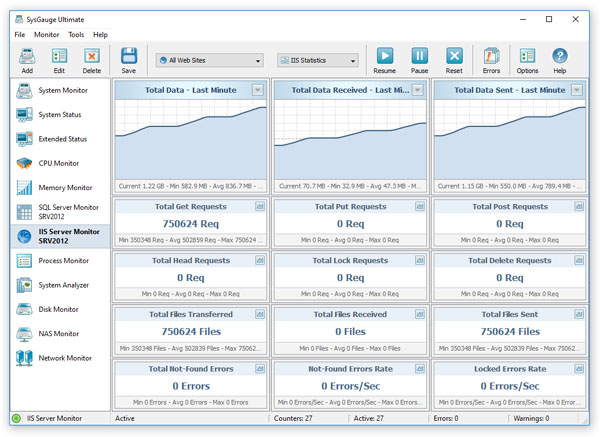
data transfer rate, HTTP requests rate and the files transfer rate. The IIS Server statistics tab displays the total amount of transferred data,
the total number of HTTP requests, the total number of transferred files, the total number of not-found errors, the not-found errors rate and the locked errors rate.
In addition to the dedicated IIS Server monitor, the user is provided with the customizable 'System Monitor' module allowing one to configure custom IIS Server
monitoring profiles. In order to add an IIS Server monitoring counter, press the 'Monitor' button located on the main toolbar, selected the 'IIS Server' counters category
in the left-side view and then select an appropriate IIS Server monitoring counter in the middle view. By default, SysGauge will monitor all web sites
on the target IIS Server, but if required, the user can select a specific web site to monitor in the right-side view. In addition, in order to monitor
a remote IIS Server via the network, press the 'Connect' button located in the bottom-left corner and specify the host name or an IP address of the remote server to monitor.

- IIS Server Data Transfer Rate - this counter monitors the data transfer rate, which is displayed in MB/Sec
- IIS Server Data Send Rate - this counter monitors the data send rate, which is displayed in MB/Sec
- IIS Server Data Receive Rate - this counter monitors the data receive rate, which is displayed in MB/Sec
- IIS Server Get Requests Rate - this counter monitors the rate of HTTP GET requests, which is displayed in Requests/Sec
- IIS Server Post Requests Rate - this counter monitors the rate of HTTP POST requests, which is displayed inn Requests/Sec
- IIS Server Head Requests Rate - this counter monitors the rate of HTTP HEAD requests, which is displayed in Requests/Sec
- IIS Server Lock Requests Rate - this counter monitors the rate of HTTP LOCK requests, which is displayed in Requests/Sec
- IIS Server Move Requests Rate - this counter monitors the rate of HTTP MOVE requests, which is displayed in Requests/Sec
- IIS Server Options Requests Rate - this counter monitors the rate of HTTP OPTIONS requests, which is displayed in Requests/Sec
- IIS Server Propfind Requests Rate - this counter monitors the rate of HTTP PROPFIND requests, which is displayed in Requests/Sec
- IIS Server Proppatch Requests Rate - this counter monitors the rate of HTTP PROPPATCH requests, which is displayed in Requests/Sec
- IIS Server Search Requests Rate - this counter monitors the rate of HTTP SEARCH requests, which is displayed in Requests/Sec
- IIS Server Delete Requests Rate - this counter monitors the rate of HTTP DELETE requests, which is displayed in Requests/Sec
- IIS Server Files Rate - this counter monitors the files transfer rate, which is displayed in Files/Sec
- IIS Server Files Send Rate - this counter monitors the files send rate, which is displayed in Files/Sec
- IIS Server Files Receive Rate - this counter monitors the files receive rate, which is displayed in Files/Sec
- IIS Server Connections - this counter monitors the current number of network connections
- IIS Server Maximum Connections - this counter monitors the maximum number of network connections
- IIS Server Connection Attempts Rate - this counter monitors the rate of network connection attempts, which is displayed in Connections/Sec
- IIS Server Anonymous Users - this counter monitors the current number of anonymous users
- IIS Server Maximum Anonymous Users - this counter monitors the maximum number of anonymous users
- IIS Server Total Anonymous Users - this counter monitors the total number of anonymous users
- IIS Server NonAnonymous Users - this counter monitors the current number of non-anonymous users
- IIS Server Maximum NonAnonymous Users - this counter monitors the maximum number of non-anonymous users
- IIS Server Total NonAnonymous Users - this counter monitors the total number of non-anonymous users
- IIS Server Logon Attempts Rate - this counter monitors the rate of user logon attempts, which is displayed in Logons/Sec
- IIS Server Not Found Errors Rate - this counter monitors the rate of not-found errors, which is displayed in Errors/Sec
- IIS Server Total Not Found Errors - this counter monitors the total number of not-found errors
- IIS Server Locked Rate - this counter monitors the rate of locked errors, which is displayed in Errors/Sec
- IIS Server Service Up Time - this counter displays the time since the IIS Server was started
- IIS Server Total Data - this counter monitors the total amount of transferred data, which is displayed in MB
- IIS Server Total Data Sent - this counter monitors the total amount of sent data, which is displayed in MB
- IIS Server Total Data Received - this counter monitors the total amount of received data, which is displayed in MB
- IIS Server Total Files - this counter monitors the total number of transferred files
- IIS Server Total Files Sent - this counter monitors the total number of sent files
- IIS Server Total Files Received - this counter monitors the total number of received files
- IIS Server Total Get Requests - this counter monitors the total number of HTTP GET requests
- IIS Server Total Put Requests - this counter monitors the total number of HTTP PUT requests
- IIS Server Total Post Requests - this counter monitors the total number of HTTP POST requests
- IIS Server Total Lock Requests - this counter monitors the total number of HTTP LOCK requests
- IIS Server Total Head Requests - this counter monitors the total number of HTTP HEAD requests
- IIS Server Total Move Requests - this counter monitors the total number of HTTP MOVE requests
- IIS Server Total Search Requests - this counter monitors the total number of HTTP SEARCH requests
- IIS Server Total Delete Requests - this counter monitors the total number of HTTP DELETE requests
- IIS Server Total Logon Attempts - this counter monitors the total number of user logon attempts
SysGauge Command Line Utility
The SysGauge command line utility, which is available in SysGauge Ultimate and SysGauge Server product versions, provides the ability to monitor
the performance of the IIS Server and save IIS Server monitoring reports from batch files and shell scripts. The command line utility is located
in the SysGauge 'bin' directory and it can be used to monitor the local or remote IIS servers via the network.
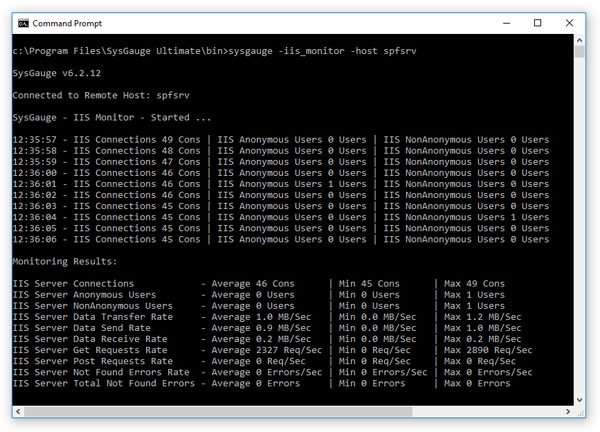
In the simplest case, open a command prompt window, go to the SysGauge 'bin' directory and type the following command:
sysgauge -iis_monitor -save_pdf_report <File Name or Directory>
This command will perform an IIS Server performance monitoring operation using a number of IIS monitoring counters including the number of IIS Server
connections, number of anonymous users, number of non-anonymous users, data transfer rate, data receive rate, data send rate, HTTP GET requests rate,
HTTP POST requests rate, page-not-found errors rate and the total number of page-not-found errors. In addition, after the monitoring operation will
be completed, SysGauge will save a PDF IIS Server performance monitoring report to the specified file or directory.
sysgauge -show_iis_sites
This command shows the list of web sites on the target IIS server.
Command Line Options:
-extended
By default, the IIS server monitor reports the total performance statistics for all web sites hosted on the monitored IIS server. This command line
option enables individual web sites performance monitoring counters for each web site and the IIS server performance monitoring results will include
individual web sites statistics for each web site hosted on the monitored IIS server.
-site <Site Name>
This option allows one to monitor only the specified web site.
-host <Remote Host Name or IP address>
This option allows one to monitor remote IIS servers via the network.
-time <Monitoring Time in Seconds>
This command line option sets the maximum monitoring time.
-silent
This command line option enables silent operation, which is useful when saving reports.
-save_html_report <File Name or Directory>
This command line option saves an HTML IIS server performance monitoring report.
-save_pdf_report <File Name or Directory>
This command line option saves a PDF IIS server performance monitoring report.
-save_excel_report <File Name or Directory>
This command line option saves an Excel IIS server performance monitoring report.
-save_text_report <File Name or Directory>
This command line option saves a text IIS server performance monitoring report.
-save_csv_report <File Name or Directory>
This command line option saves a CSV IIS server performance monitoring report.
-save_xml_report <File Name or Directory>
This command line option saves an XML IIS server performance monitoring report.
-save_to_database <Table Name>
This command line option saves monitoring results to the specified SQL database table.