The 'Process Monitor' GUI module is a dedicated process monitoring module showing the list of currently running processes and displaying
for each process the process CPU usage, the memory usage, the number of threads, the number of handles, the number of process instances,
the process data transfer rate, the process read transfer rate, the process write transfer rate, the process page fault rate and the amount
of non-paged memory allocated by each running process.
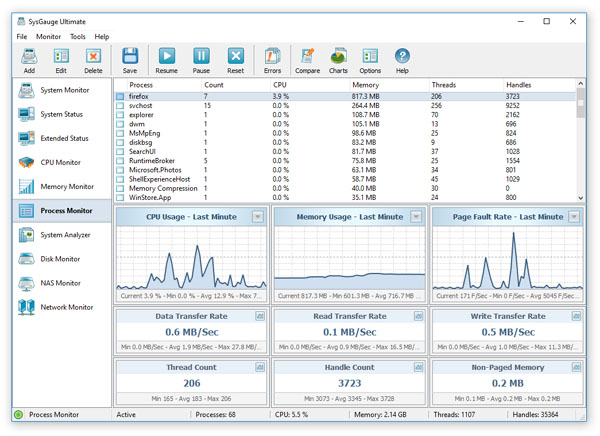
The top side of the process monitor displays the list of currently running processes and the bottom side of the window includes three data chards
and a number of counters showing the monitoring data for the currently selected process. In order to open a detailed process monitoring dialog
for a specific process, double click on the required process item in the lst of currently running processes.
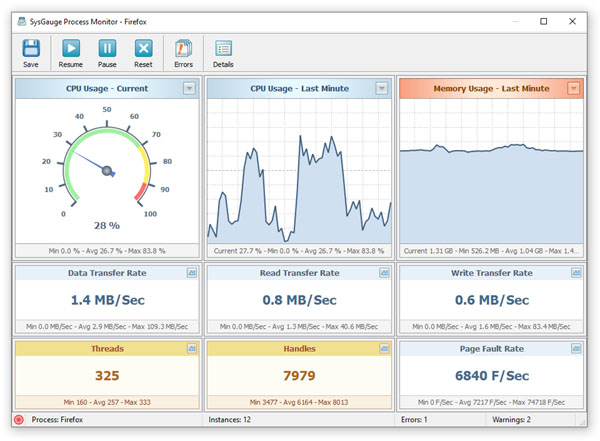
The process monitoring dialog shows the process CPU usage, the process memory usage, the process page-fault rate, the process data transfer rate,
the process thread count, the process handle count and the amount of non-paged memory allocated by the process.
Process Monitoring Reports
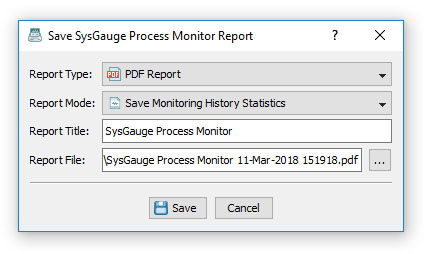
One of the most useful capabilities of the SysGauge process monitor is the ability to save process monitoring reports to a number of standard formats
including HTML, PDF, Excel, text, CSV and XML. In order to save a process monitoring report, press the 'Save' button located on the main toolbar,
select an appropriate report format and report mode, enter a report file name and press the 'Save' button.
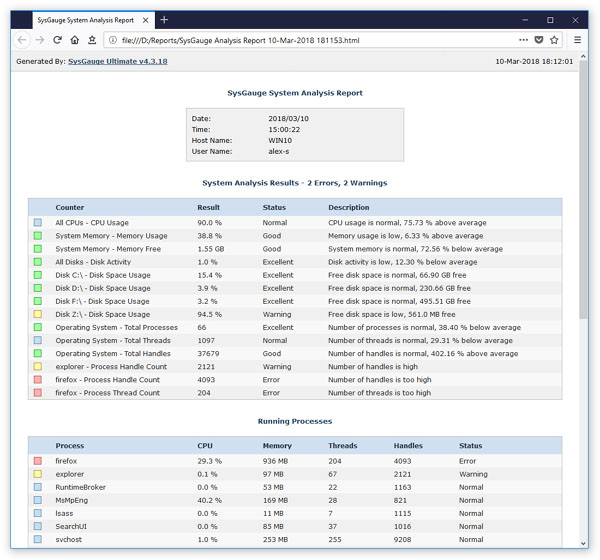
The SysGauge process monitoring report begins with a summary table showing the total number of processes, the total number of process instances,
the total memory usage for all processes, the total number of threads for all processes and the total number of handles for all processes.
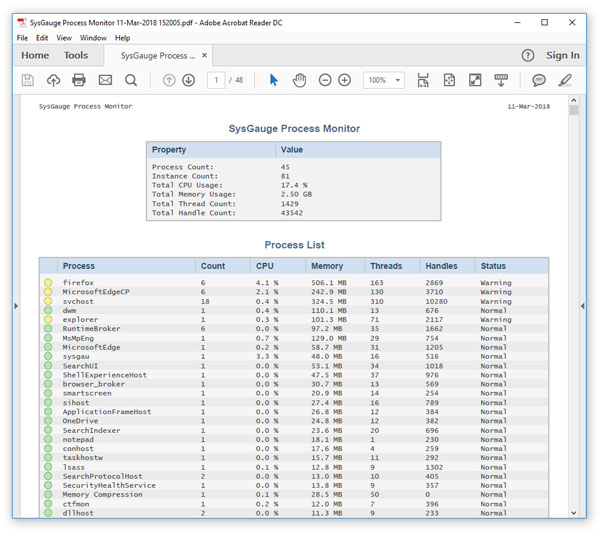
The summary table is followed by the process list table showing summary information for each process including: the process status, the process name,
the process instance count, the process CPU usage, the process memory usage, the process thread count and the process handle count.
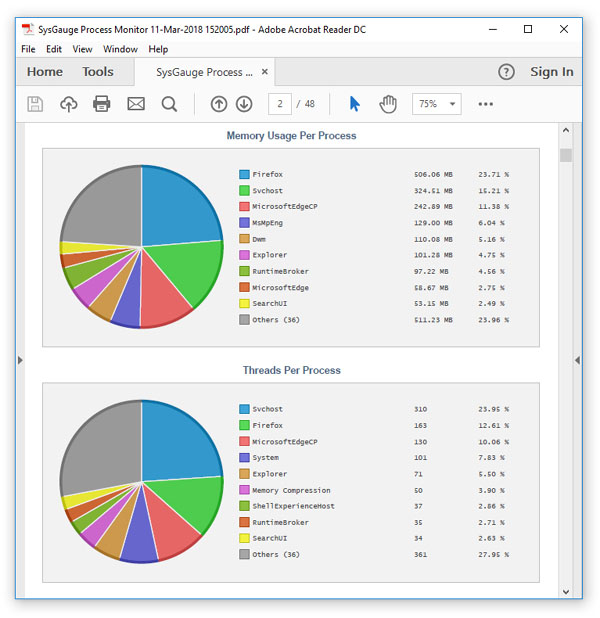
The process list table is followed by a number of pie charts showing the CPU usage per process, the memory usage per process, the number of threads per
process and the number of handles per process, allowing one to easily identify processes consuming substantial amounts of system resources.
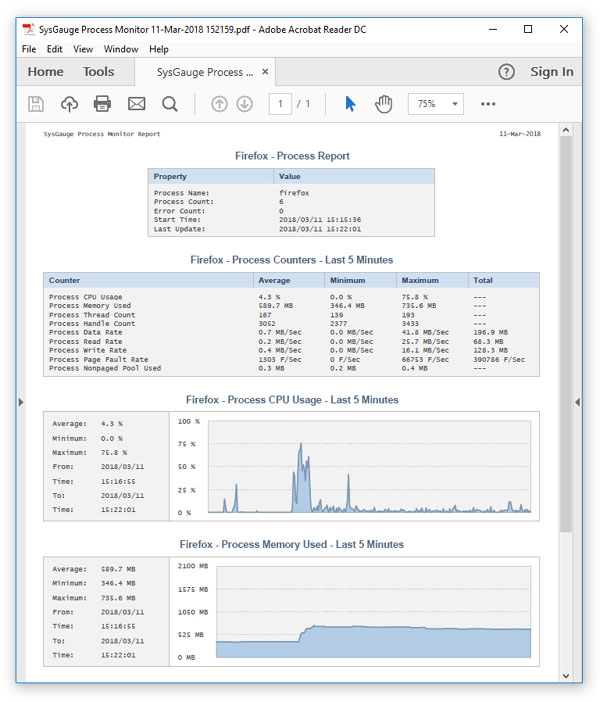
The statistical pie charts are followed by a number of tables showing detailed process information and history charts. For each running process,
the report includes a summary table, a list of process monitoring counters with the average, minimum and maximum values for each monitoring
counter and a number of charts showing the monitoring history.
Process Monitoring Rules
The SysGauge process monitor provides the user with the ability to define conditional process monitoring rules allowing one to automatically
detect processes consuming excessive amounts of system resources and then play notification sounds, send E-Mail notifications or execute
custom actions according to user-specified rules and policies.
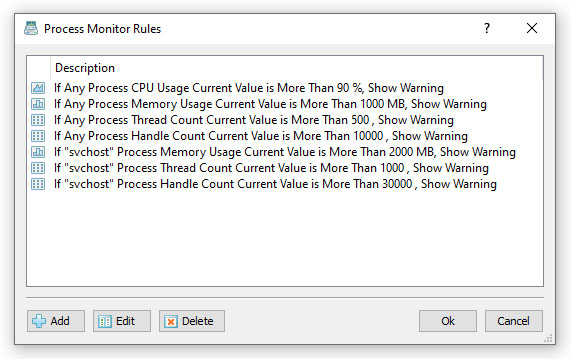
In order to add one or more process monitoring rules, open the 'Options' dialog, select the 'Rules' tab and press the 'Add' button. On the 'Add Rule' dialog
select a process monitoring counter, specify a condition that should trigger the rule, select an action type and specify an action value if required.
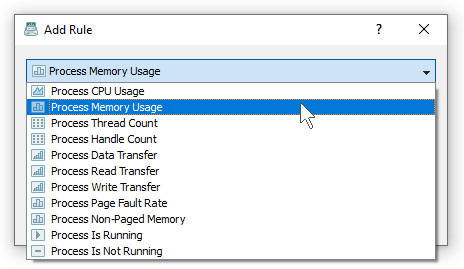
For example, in order to send an E-Mail notification for any process consuming more than 90 percent of the CPU time, select the 'Process CPU Usage' counter type,
set the rule condition to 'Current Value More Than 90', select the 'E-Mail Notification' action type and enter an E-Mail address to send notifications to.
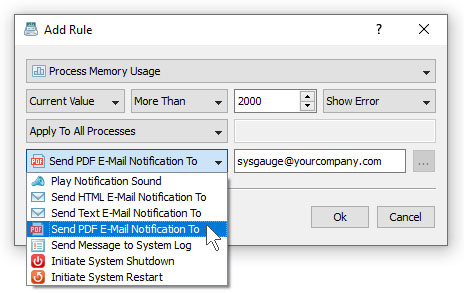
In addition, select the 'E-Mail' tab and specify an SMTP E-Mail server to use to send E-Mail notifications. During the process monitoring operation, SysGauge
will check the selected process monitoring counters for each running process and send E-Mail notifications for all processes consuming more than the user-specified
amount of system resources.
Monitoring User-Designated Processes
In addition to the global process monitoring rules, which are applied to all running processes, the user is provided with the ability to configure rules and policies
for user-designated processes allowing one to automatically check if a process is running or not running and monitor the process CPU usage, process memory usage,
number of threads, number of handles, process data transfer rate, process read transfer rate, process write transfer rate, process page fault rate and the amount
of the process non-paged memory.
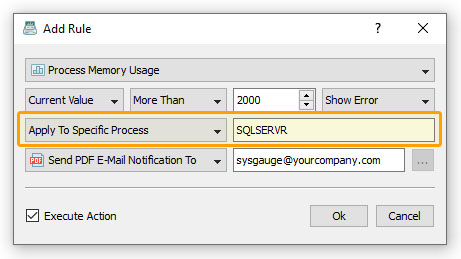
In order to add a process monitoring rule, select the 'Process Monitor' module on the left side-bar, press the 'Rules' button located on the main toolbar and press
the 'Add' button. On the process rule dialog, specify the name of the process to apply the rule to, select the process monitoring rule type and specify a process
monitoring condition. If required, enable process monitoring actions and select an appropriate process monitoring action type.
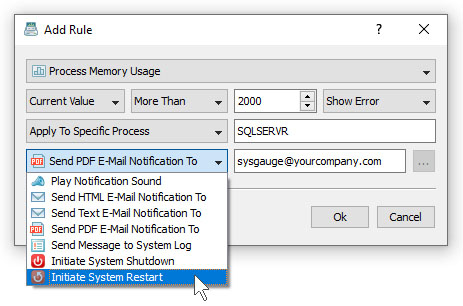
For example, the user is provided with the ability to play notification sounds, select E-Mail notifications, send messages to the system event log or restart
the system if one or more user-designated processes are not running or consuming too much of the system resources.
Process Comparison
Sometimes, it may be required to compare two running processes in order to understand which of the two processes consumes less system resources while performing the same operation.
For example, there are many different web browser applications providing very similar sets of features, but consuming different amounts of system resources while performing exactly the same operation.
In order to compare two processes using the SysGauge process monitor, select a process item in the process view, press the right mouse button and select
the 'Compare Process' menu item. On the 'Compare Process' dialog, use the process selection combo boxes to select a pair or processes to compare.
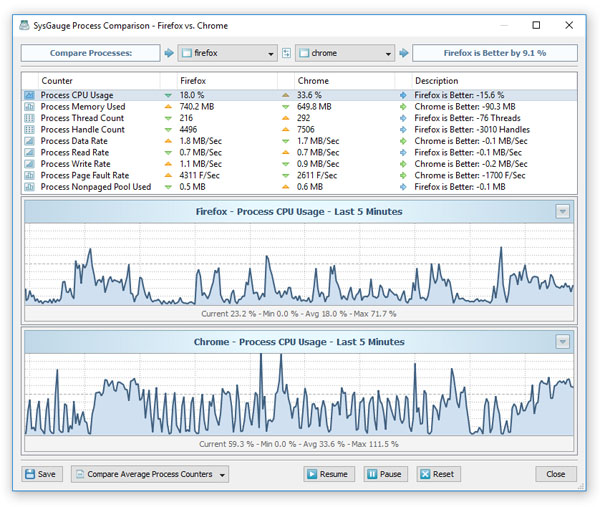
For each of the selected processes, SysGauge will monitor and compare the process CPU usage, the amount of system memory used by the process, the process thread count,
the process handle count, the process data transfer rate, the process read transfer rate, the process write transfer rate, the process page fault rate and the amount
of the non-paged memory used by the process.
The top view of the process comparison dialog displays the list process monitoring counters for the compared processes and the differences between the compared processes.
In addition, the process comparison dialog shows two data charts showing the process monitoring data for the compared processes according to the currently selected process monitoring counter.
By default, the process comparison dialog shows the differences between the current values of the process monitoring counters. In addition, the user is provided
with the ability to compare the average values of the process monitoring counters allowing one to understand how much of the system resources the compared processes
consume over time and under different usage scenarios. In order to switch to the average counter values, use the comparison mode combo box located in the bottom-left corner of the dialog.
Process Comparison Reports
The SysGauge process monitor provides the ability to save process comparison reports to a number of standard formats including HTML, PDF, Excel, text, CSV and XML.
In order to save a process comparison report, press the save button located in the bottom-left corner of the process comparison dialog.
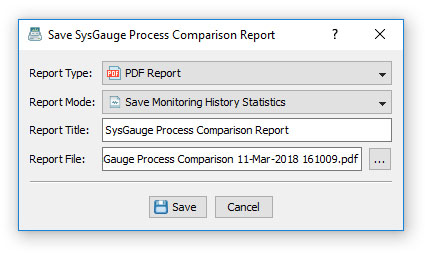
On the 'Save Report' dialog, select an appropriate report format, select a report mode, enter a report title, enter a report file name and press the 'Save' button.
A SysGauge process comparison report begins with a summary table showing the report date and time, the report host name and the name of the user generated the report.
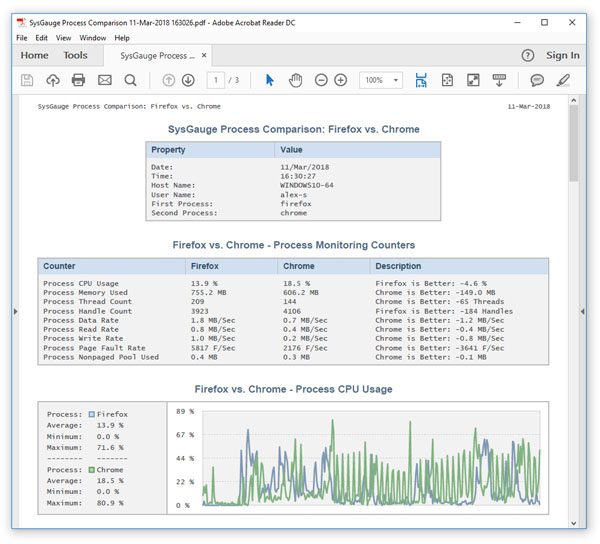
The summary table is followed by a table showing the list of process monitoring counters including the process CPU usage, process memory usage, thread count, handle count,
data transfer rate, read transfer rate and write transfer rate for both processes. The list of process monitoring counters is followed by a number of comparison charts
showing the difference between the processes for all process monitoring counters.
Process Monitoring Logs
In order to enable users to identify which previously active processes used significant amounts of system resources, the SysGauge process monitor provides the process
monitoring log showing the running time, CPU usage and memory usage for each completed process. In order to display the process monitoring log, set the process monitor
display mode to 'Process Log'.
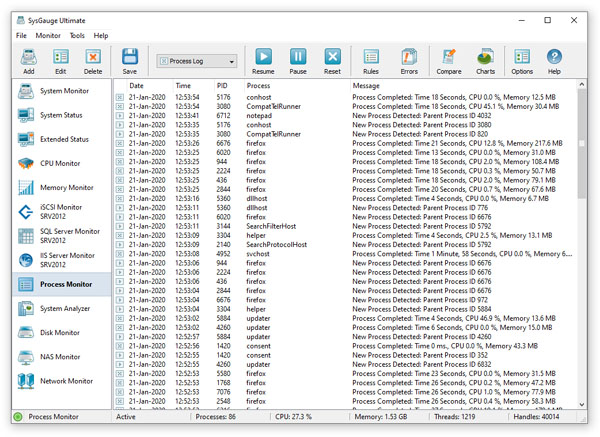
For each newly detected process, the process log shows the date and time, the process ID, process name the and the parent process ID. For each completed process,
the process log shows the completion date and time, the process ID, the process name, the process running time, the average CPU usage and the process memory usage.
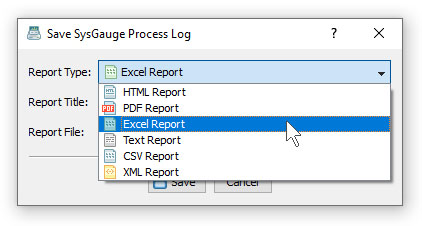
Finally, users are provided with the ability to save the process log to a number of different formats including HTML, PDF, Excel, text, CSV and XML.
In order to save the process log, press the 'Save' button located on the main toolbar, select an appropriate log format, enter a file name and press the 'Save' button.
Process Monitoring Counters
In addition to the dedicated process monitor module, the user can use the customizable 'System Monitor' module to configure user-custom process monitoring profiles.
In order to add a process status counter, press the 'Add' button located on the main toolbar, selected the 'Process Status' counters category
in the left-side view, select an appropriate process status counter in the middle view and then select the required process to monitor in the
right-side view. In addition, in order to monitor the process status in a remote computer via the network, press the 'Connect' button located
in the bottom-left corner and specify the host name of the remote computer to monitor.
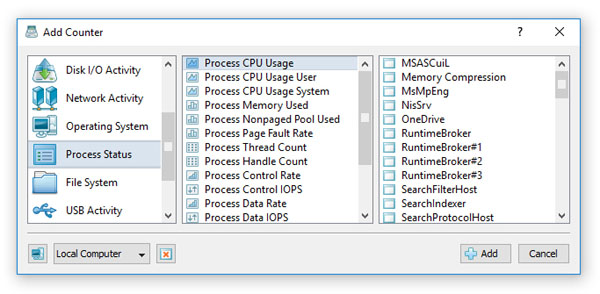
- Process CPU Usage - this counter shows the percentage of elapsed time that all threads of the selected process used the processor to execution instructions. An instruction is the basic unit of execution in a computer, a thread is the object that executes instructions, and a process is the object created when a program is run.
- Process CPU Usage User - this counter shows the percentage of elapsed time that all threads of the selected process spent executing code in the user mode. Applications, environment subsystems, and integral subsystems execute in user mode. Code executing in user mode cannot damage the integrity of the Windows executive, kernel, and device drivers.
- Process CPU Usage System - this counter shows the percentage of elapsed time that all threads of the selected process spent executing code in the system privileged mode.
- Process Memory Used - this counter shows the amount of the system memory in Megabytes used by the selected process.
- Process Handle Count - this counter displays the total number of handles currently open in the selected process. This number is equal to the sum of the handles currently open in each thread of the selected process.
- Process Thread Count - this counter displays the number of threads currently active in the selected process. An instruction is the basic unit of execution in a processor and a thread is the object that executes instructions. Every running process has at least one thread.
- Process Control Rate - this counter measures the rate in Megabytes per second at which the selected process is issuing I/O operations that do not involve data such as control operations. This counter measures all I/O activity generated by the process including file, network and device I/Os.
- Process Control IOPS - this counter measures the rate in operations per second (IOPS) at which the selected process is issuing I/O operations that are neither read nor write operations (for example, a control function). This counter measures all I/O activity generated by the process including file, network and device I/Os.
- Process Data Rate - this counter measures the data rate in Megabytes per second at which the selected process is reading and writing data in I/O operations. This counter measures all I/O activity generated by the process including file, network and device I/Os.
- Process Data IOPS - this counter measures the rate in operations per second at which the selected process is issuing read and write I/O operations. This counter measures all I/O activity generated by the process including file, network and device I/Os.
- Process Read Rate - this counter measures the data read rate in Megabytes per second at which the selected process is reading data in I/O operations. This counter measures all I/O activity generated by the process including file, network and device I/Os.
- Process Read IOPS - this counter measures the data read rate in operations per second at which the selected process is issuing read I/O operations. This counter measures all I/O activity generated by the process including file, network and device I/Os.
- Process Write Rate - this counter measures the data write rate in Megabytes per second at which the selected process is writing data in I/O operations. This counter measures all I/O activity generated by the process including file, network and device I/Os.
- Process Write IOPS - this counter measures the data write rate in operations per second at which the selected process is issuing write I/O operations. This counter measures all I/O activity generated by the process including file, network and device I/Os.
SysGauge Server
In addition to the SysGauge desktop product version, the user is provided with the SysGauge Server product version, which runs in the background
as a Windows service and allows one to continuously monitor the running processes even when no users are logged into the computer.
One of the major advantages of the SysGauge Server product version is the ability to perform multiple monitoring operations
at the same time allowing one to monitor different components of the system such the SQL Database, NAS Server, IIS Server,
Active Directory, etc. and/or monitor multiple servers via the network.
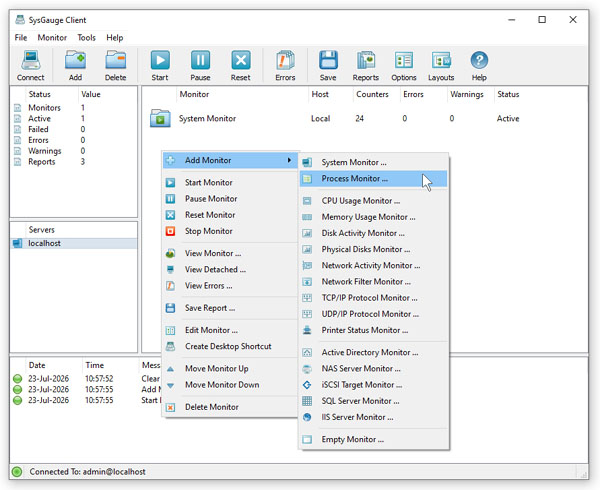
In order to add a process monitor using the SysGauge Server GUI application, press the right mouse button over the monitors view and select
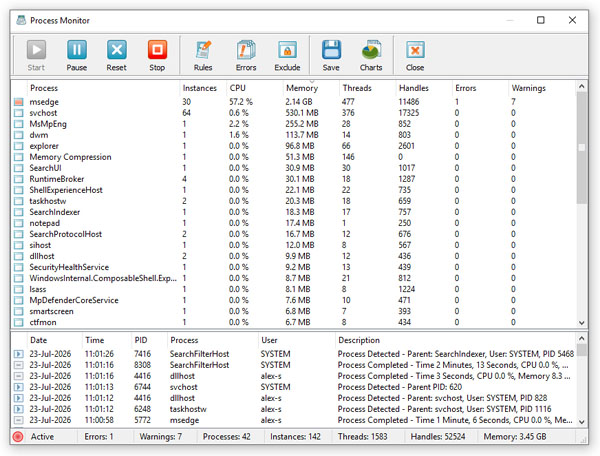
the 'Add Monitor - Process Monitor' menu item. The top view of the process monitor dialog shows the list of the currently running processes
and the bottom view shows the process log listing the date and time of newly detected and completed processes including the process ID,
process name, user name and a short description for each process log item.
In order to open a process, double-click on the process item in the process view. The process dialog’s top status pane shows the process status,
the middle view shows the gauge and the line chart for the currently selected process monitoring counter and the bottom view shows the list
of all process monitoring counters allowing one to select what is displayed on the process monitor dialog’s gauge and line chart.
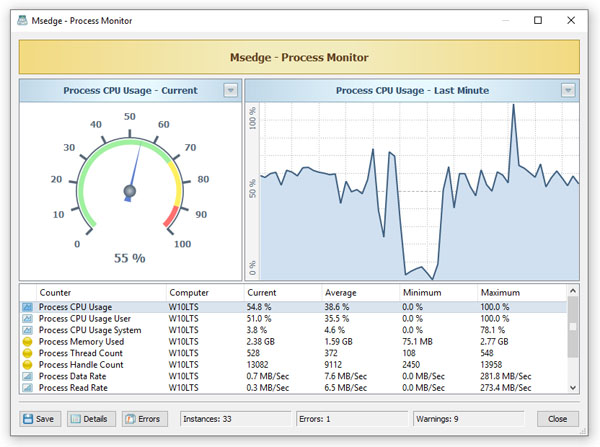
In order to open a number of process monitor dialogs for multiple processes at the same time, select a process item in the process view,
press the right mouse button and select the 'View Detached' menu item. The SysGauge Server GUI application will open a completely separated
process monitoring dialog for the selected process allowing one to open a number of process monitoring dialogs for different processes
and position the process monitoring dialogs on multiple physical displays.
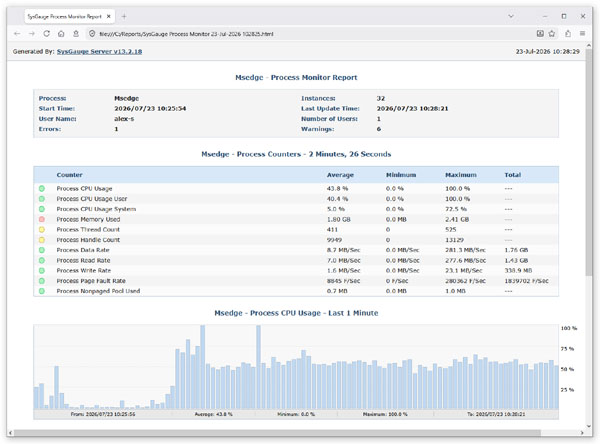
In order to save a process monitoring report for the currently displayed process, press the 'Save' button located in the bottom-left corner
of the process monitoring dialog, select an appropriate process monitoring report format and report mode and press the 'Save' button.
For example, PDF and HTML process monitoring reports will display the process summary view followed by the list of process monitoring
counters and then a line chart for each process monitoring counter.
SysGauge Command Line Utility
The SysGauge command line utility, which is available in SysGauge Ultimate and SysGauge Server product versions, provides the ability to monitor the running processes and save process monitoring reports
from batch files and shell scripts. The command line utility is located in the SysGauge 'bin' directory and it can be used to monitor the local system or remote servers
via the network. In the simplest case, open a command prompt window, go to the SysGauge 'bin' directory and type the following command:
sysgauge -process_monitor
This command will perform a process monitoring operation using a number of counters for each running process including the process CPU usage, the process memory usage,
the process thread count, the process handle count, the process data transfer rate, the process read transfer rate, the process write transfer rate, the process memory
page fault rate and the process non-paged memory size. Optionally, the user can save a process monitoring report into the PDF, HTML, Excel, CSV, text, JSON or XML
report formats showing per-process resource usage statistics and all the details for all running processes.
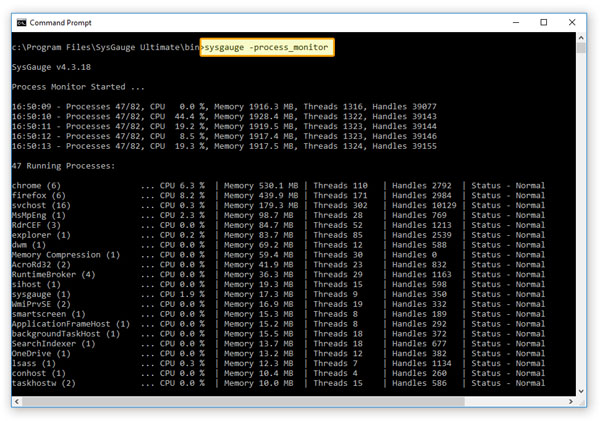
In addition to the ability to monitor all running processes, the SysGauge command line utility allows one to monitor a single user-specified process and optionally
save a process monitoring report into the PDF, HTML, Excel, CSV, text, JSON and XML report formats showing all the process details and resource usage charts.
For example, in order to monitor the FireFox web browser process and save a PDF process monitoring report, type the following command:
sysgauge -process_monitor firefox –save_pdf_report [Dir Name or File Name]
If the specified process is not running at the time when the command is executed, the SysGauge command line utility will wait for the process and then start the process
monitoring operation. In order to stop the running monitoring operation, press the 'ECS' key. Another way to terminate the process monitoring operation and optionally
save a process monitoring report is to use the '-time' command line parameter and specify the maximum monitoring time is seconds.
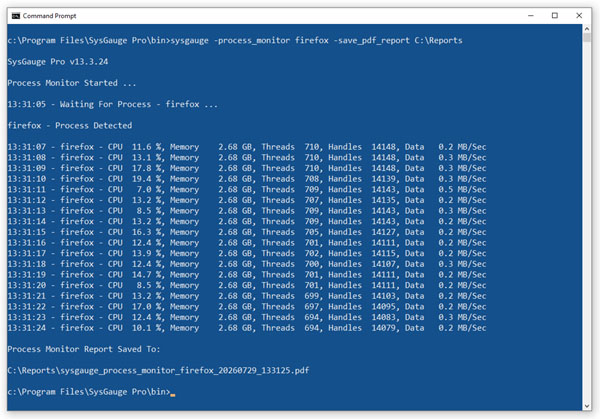
Command Line Options:
-host <Remote Host Name or IP address>
This option allows one to monitor the running processes in remote servers via the network.
-time <Monitoring Time in Seconds>
This command line option sets the maximum monitoring time.
-silent
This command line option enables silent operation, which is useful when saving reports.
-save_html_report <File Name or Directory>
This command line option saves an HTML process monitoring report.
-save_pdf_report <File Name or Directory>
This command line option saves a PDF process monitoring report.
-save_excel_report <File Name or Directory>
This command line option saves an Excel process monitoring report.
-save_text_report <File Name or Directory>
This command line option saves a text process monitoring report.
-save_csv_report <File Name or Directory>
This command line option saves a CSV process monitoring report.
-save_xml_report <File Name or Directory>
This command line option saves an XML process monitoring report.
-save_to_database <Table Name>
This command line option saves monitoring results to the specified SQL database table.