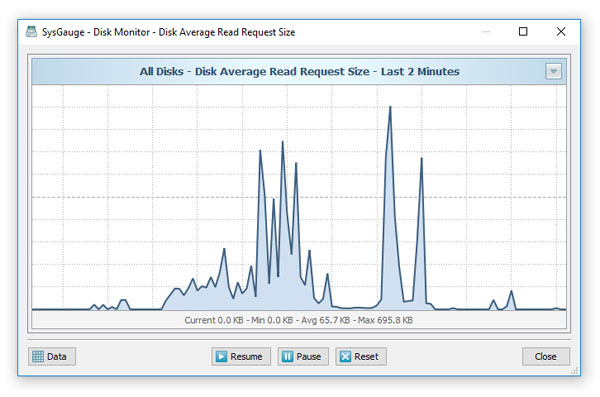
The 'Disk Monitor' GUI module is a dedicated disk monitoring module showing the list of logical disks in the computer and displaying the disk activity,
the disk space usage, the disk free space, the disk transfer rate, the disk read transfer rate, the disk write transfer rate, the disk IOPS rate, the disk
read IOPS rate and the disk write IOPS rate for the currently selected logical disk.
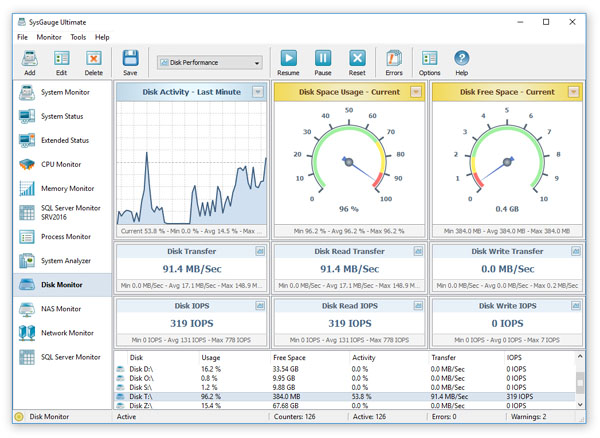
The disk activity chart allows one to display the monitoring data for the last minute, last 2 minutes or last 5 minutes. The disk space usage gauges, which
are located on the top-side of the window, provide the ability to display the current value, average value or the maximum value. In addition, all disk
monitoring counters, display the minimum, maximum and average value on the counter's status bar.
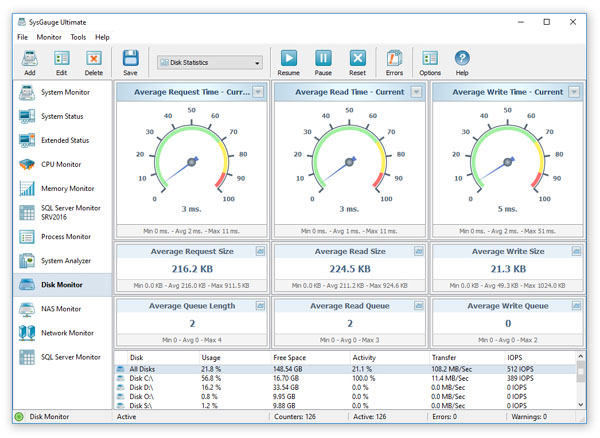
The 'Disk Statistics' module shows the average disk request time, average disk read time, average disk write time, average disk request size, average disk read size,
average disk write size, average disk queue length, average disk read queue length and the average disk write queue length.
In order to open a history chart dialog for a disk monitoring counter, press the 'Chart' button located in the top-right corner of the required disk monitoring counter.
The history chart dialog allows one to show the monitoring history for the last 1, 2 or 5 minutes. In order to change the history time-frame, press the 'History' button
located in the top-right corner of the history chart dialog.
Advanced users are provided with the ability to access the raw disk monitoring data, save various types of monitoring reports and export the monitoring data to an SQL database.
In order to access the raw monitoring data, press the 'Data' button located in the bottom-left corner of the history chart dialog.
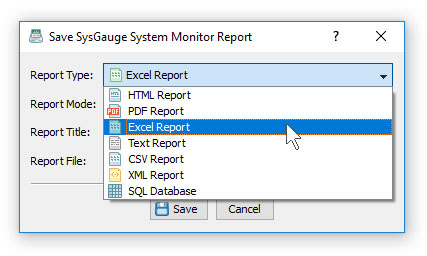
In addition, the user is provided with the ability to save disk monitoring reports into a number of standard formats including HTML, PDF, Excel, text, CSV and XML.
In order to save a disk monitoring report, press the 'Save' button located on the main toolbar, select an appropriate report format, enter a report file name and press the 'Save' button.
Disk Monitoring Counters
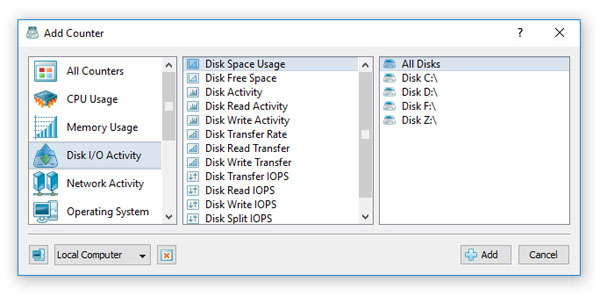
In addition to the dedicated disk monitor module, the user can use the customizable 'System Monitor' module to configure user-custom disk monitoring profiles.
In order to add a disk activity counter, press the 'Add' button located on the main toolbar, selected the 'Disk Activity' counters category in the left-side view and
then select an appropriate disk activity counter in the middle view. By default, SysGauge will monitor all disks installed in the computer, but if required, the user
can select a specific disk to monitor in the right-side view. In addition, in order to monitor the disk activity in a remote computer via the network,
press the 'Connect' button located in the bottom-left corner and specify the host name of the remote computer to monitor.
- Disk Space Usage - this counter measures the percentage of the used disk space.
- Disk Free Space - this counter measures the amount of the free disk space.
- Disk Activity - this counter measures the percentage of elapsed time that the selected disk drive was busy servicing read or write requests.
- Disk Read Activity - this counter measures the percentage of elapsed time that the selected disk drive was busy servicing read requests.
- Disk Write Activity - this counter measures the percentage of elapsed time that the selected disk drive was busy servicing write requests.
- Disk Transfer Rate - this counter measures the disk data transfer rate in Megabytes to or from the disk during write or read operations.
- Disk Read Transfer - this counter measures the disk data transfer rate in Megabytes from the disk during read operations.
- Disk Write Transfer - this counter measures the disk data transfer rate in Megabytes to the disk during write operations.
- Disk Transfer IOPS - this counter measures the rate of read and write operations per second (IOPS) on the selected disk.
- Disk Read IOPS - this counter measures the rate of read operations per second (IOPS) on the selected disk.
- Disk Write IOPS - this counter measures the rate of write operations per second (IOPS) on the selected disk.
- Disk Split IOPS - this counter measures the rate at which I/Os to the disk were split into multiple I/Os. A split I/O may result from requesting data of a size that is too large to fit into a single I/O or that the disk is fragmented.
- Disk Average Request Size - this counter measures the average disk I/O request size, which is displayed in KB.
- Disk Average Read Request Size - this counter measures the average disk read request size, which is displayed in KB.
- Disk Average Write Request Size - this counter measures the average disk write request size, which is displayed in KB.
- Disk Average Request Time - this counter measures the average disk I/O request time, which is displayed in milliseconds.
- Disk Average Read Request Time - this counter measures the average disk read request time, which is displayed in milliseconds.
- Disk Average Write Request Time - this counter measures the average disk write request time, which is displayed in milliseconds.
- Disk Average Queue Length - this counter measures the average disk queue length, which shows the average number of pending disk I/O requests.
SysGauge Command Line Utility
The SysGauge command line utility, which is available in SysGauge Ultimate and SysGauge Server product versions, provides the ability to monitor the disk activity and save disk activity monitoring
reports from batch files and shell scripts. The command line utility is located in the SysGauge 'bin' directory and it can be used to monitor the local system
or remote servers via the network.
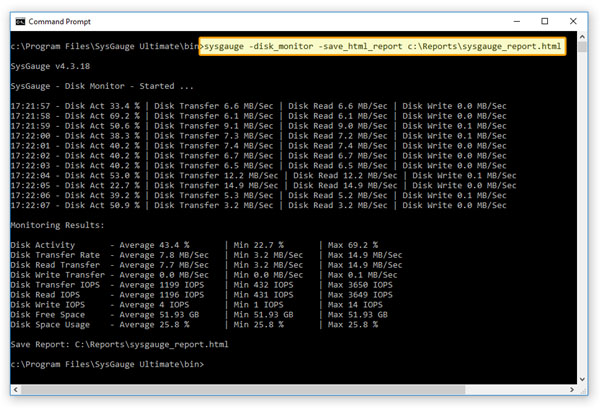
In the simplest case, open a command prompt window, go to the SysGauge 'bin' directory and type the following command:
sysgauge -disk_monitor -save_html_report <File Name or Directory>
This command will perform a disk activity monitoring operation using a number of disk monitoring counters including the disk activity, disk transfer rate,
disk read transfer rate, disk write transfer rate, disk transfer IOPS, disk read transfer IOPS, disk write transfer IOPS, disk free space and disk space usage.
In addition, after the monitoring operation will be completed, SysGauge will save an HTML disk activity monitoring report to the specified file or directory.
Command Line Options:
-extended
By default, the disk activity monitor reports the total disk activity statistics for all logical disks in the monitored system. This command line option enables individual disk activity monitoring counters for each logical disk and the disk activity monitoring results will include individual disk activity statistics for each logical disk in the monitored system.
-host <Remote Host Name or IP address>
This option allows one to monitor the disk activity in remote servers via the network.
-time <Monitoring Time in Seconds>
This command line option sets the maximum monitoring time.
-silent
This command line option enables silent operation, which is useful when saving reports.
-save_html_report <File Name or Directory>
This command line option saves an HTML disk activity monitoring report.
-save_pdf_report <File Name or Directory>
This command line option saves a PDF disk activity monitoring report.
-save_excel_report <File Name or Directory>
This command line option saves an Excel disk activity monitoring report.
-save_text_report <File Name or Directory>
This command line option saves a text disk activity monitoring report.
-save_csv_report <File Name or Directory>
This command line option saves a CSV disk activity monitoring report.
-save_xml_report <File Name or Directory>
This command line option saves an XML disk activity monitoring report.
-save_to_database <Table Name>
This command line option saves monitoring results to the specified SQL database table.