The 'NAS Monitor' GUI module is a dedicated NAS server monitoring module showing the list of network shares in the NAS server and displaying
the data transfer rate, the data request rate, the number of pending requests, the read transfer rate, the write transfer rate, the read request rate,
the write request rate, the number of currently open files and the total number of opened files since the NAS server was started for the currently selected network share.
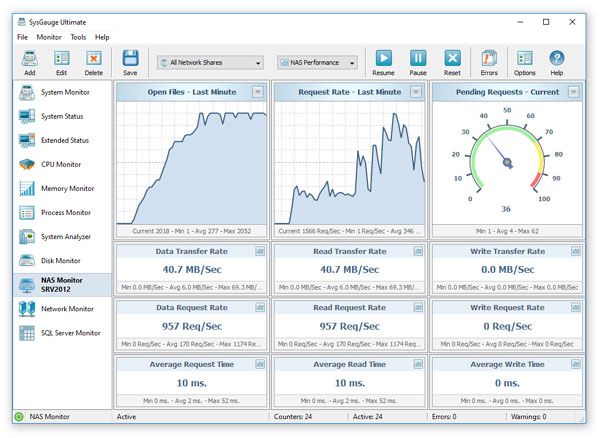
The data transfer and the data request rate charts located on the top side of the NAS monitor module allow one to display the monitoring data for the last minute,
last 2 minutes or last 5 minutes. In addition, the user is provided with the ability to display data charts from all other counters by pressing
on the 'Chart' button located in the top-right corner of each counter.
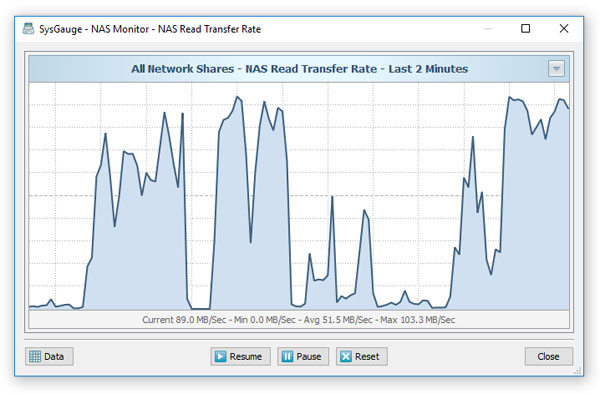
The data chart dialog provides the ability to view the monitoring data for the last minute, last 2 minutes or last 5 minutes. In addition, the user is provided with
the ability export the counter's monitoring data, pause, resume and reset the monitor.
NAS Monitoring Reports
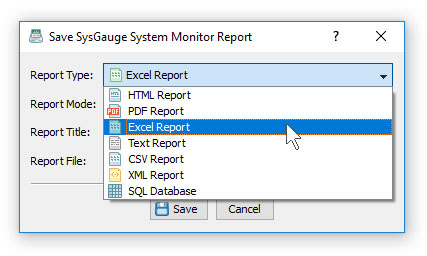
The SysGauge NAS performance monitor provides the user with the ability to save NAS performance monitoring reports to a number of standard formats including HTML,
PDF, Excel, text, CSV and XML. In order to save a NAS performance monitoring report, press the 'Save' button located on the main toolbar, select an appropriate report
format and report mode, enter a report file name and press the 'Save' button.
A SysGauge NAS performance monitoring report begins with a summary table showing the report date and time, the report host name and the name of the user generated
the NAS performance monitoring report. The summary table is followed by the list of NAS performance monitoring counters showing the average, minimum and maximum
values for each NAS performance monitoring counter.
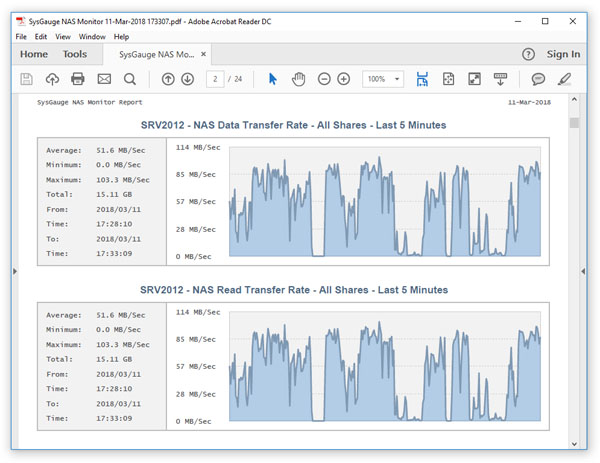
The counter list is followed by a number of data charts showing the NAS performance monitoring data for each NAS performance monitoring counter. In addition,
if selected by the user, the report may include NAS performance history statistics and full monitoring data for all NAS performance monitoring counters.
NAS Monitoring Counters
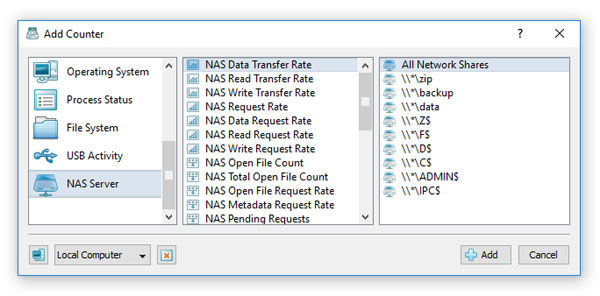
In addition to the dedicated NAS monitor module, the user can use the customizable 'System Monitor' module to configure user-custom NAS server monitoring profiles.
In order to add a NAS performance monitoring counter, press the 'Add' button located on the main toolbar, selected the 'NAS Server' counters category in the left-side view,
select an appropriate NAS performance monitoring counter in the middle view and then select the required network share in the right-side view. In addition, in order to monitor
the performance of a remote NAS server via the network, press the 'Connect' button located in the bottom-left corner and specify the host name of the remote server to monitor.
- NAS Data Transfer Rate - this counter measures the rate, in MB per second, at which data is being written to or read from this NAS server.
- NAS Read Transfer Rate - this counter measures the rate, in MB per second, at which data is being read from this NAS server.
- NAS Write Transfer Rate - this counter measures the rate, in MB per second, at which data is being written to this NAS server.
- NAS Request Rate - this counter measures the rate, in requests per second, at which read or write requests are received by this NAS server.
- NAS Data Request Rate - this counter measures the rate, in requests per second, at which data requests are received by this NAS server.
- NAS Read Request Rate - this counter measures the rate, in requests per second, at which read requests are received by this NAS server.
- NAS Write Request Rate - this counter measures the rate, in requests per second, at which write requests are received by this NAS server.
- NAS Open File Count - this counter shows the number of files that are currently open in this NAS server on behalf of its clients.
- NAS Total Open File Count - this counter shows the number of files that have been opened by the NAS file server on behalf of its clients since the server started.
- NAS Open File Request Rate - this counter measures the rate, in requests per second, at which files are being opened for the NAS server's clients.
- NAS Metadata Request Rate - this counter measures the rate, in requests per seconds, at which metadata requests are being sent to this NAS server.
- NAS Pending Requests - this counter shows the current number of requests are waiting to be processed by the NAS file server.
- NAS Data Queue Length - this counter shows the current number of read or write requests outstanding on this NAS server.
- NAS Network Transfer Rate - this counter measures the rate, in MB per second, at which data is being received and sent for requests related to this NAS server including the application data as well as the network protocol data.
- NAS Network Received Rate - this counter measures the rate, in MB per second, at which data is being received for requests related to this NAS server including the application data as well as the network protocol data.
- NAS Network Sent Rate - this counter measures the rate, in MB per second, at which data is being sent for requests related to this NAS server including the application data as well as the network protocol data.
- NAS Average Request Size - this counter shows the average size of data requests in KB.
- NAS Average Read Request Size - this counter shows the average size of read requests in KB.
- NAS Average Write Request Size - this counter shows the average size of write requests in KB.
- NAS Average Data Queue Length - this counter shows the average number of read and write requests that were queued by this NAS file server.
- NAS Average Read Queue Length - this counter shows the average number of read requests that were queued by this NAS file server.
- NAS Average Write Queue Length - this counter shows the average number of write requests that were queued by this NAS file server.
- NAS Average Request Time - this counter shows the average number of milliseconds that elapse between the time at which the NAS file server receives a request and the time at which the server sends the corresponding response.
- NAS Average Data Request Time - this counter shows the average number of milliseconds that elapse between the time at which the NAS file server receives a data request and the time at which the server sends the corresponding response.
- NAS Average Read Request Time - this counter shows the average number of milliseconds that elapse between the time at which the NAS file server receives a read request and the time at which the server sends the corresponding response.
- NAS Average Write Request Time - this counter shows the average number of milliseconds that elapse between the time at which the NAS file server receives a write request and the time at which the server sends the corresponding response.
SysGauge Command Line Utility
The SysGauge command line utility, which is available in SysGauge Ultimate and SysGauge Server product versions, provides the ability to monitor the performance of NAS servers
and save NAS monitoring reports from batch files and shell scripts. The command line utility is located in the SysGauge 'bin' directory and
it can be used to monitor the local system or remote NAS servers via the network.
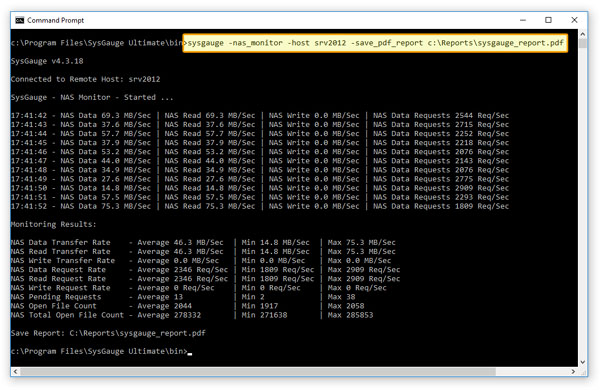
In the simplest case, open a command prompt window, go to the SysGauge 'bin' directory and type the following command:
sysgauge -nas_monitor -save_pdf_report <File Name or Directory>
This command will perform a NAS performance monitoring operation using a number of NAS monitoring counters including the NAS data transfer rate,
NAS read transfer rate, NAS write transfer rate, NAS data request rate, NAS read request rate, NAS write request rate, NAS pending requests,
the current NAS open file count and the total number of open files since the NAS server was started. In addition, after the monitoring
operation will be completed, SysGauge will save a PDF NAS performance monitoring report to the specified file or directory.
Command Line Options:
-extended
By default, the NAS performance monitor reports the total NAS performance statistics for all network shares in the monitored NAS server.
This command line option enables individual network shares performance monitoring counters for each network share and the NAS performance
monitoring results will include individual network shares statistics for each network share in the monitored NAS server.
-host <Remote Host Name or IP address>
This option allows one to monitor the NAS performance in remote servers via the network.
-time <Monitoring Time in Seconds>
This command line option sets the maximum monitoring time.
-silent
This command line option enables silent operation, which is useful when saving reports.
-save_html_report <File Name or Directory>
This command line option saves an HTML NAS performance monitoring report.
-save_pdf_report <File Name or Directory>
This command line option saves a PDF NAS performance monitoring report.
-save_excel_report <File Name or Directory>
This command line option saves an Excel NAS performance monitoring report.
-save_text_report <File Name or Directory>
This command line option saves a text NAS performance monitoring report.
-save_csv_report <File Name or Directory>
This command line option saves a CSV NAS performance monitoring report.
-save_xml_report <File Name or Directory>
This command line option saves an XML NAS performance monitoring report.
-save_to_database <Table Name>
This command line option saves monitoring results to the specified SQL database table.