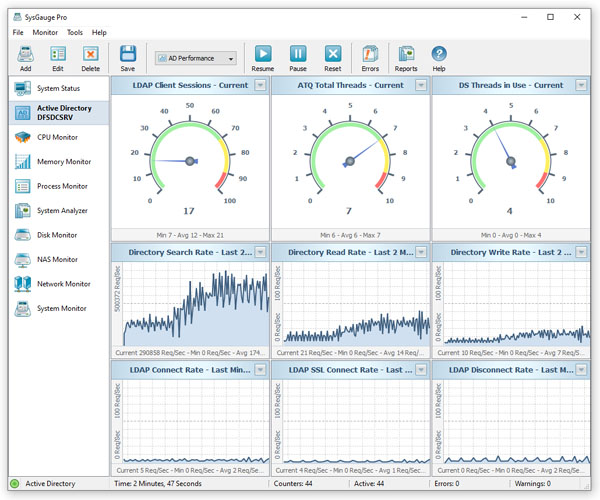
In order to allow users quickly check the current system status, SysGauge provides the 'System Analyzer' module allowing one to automatically analyze the current system resource usage,
check all critical issues and show an easy-to-understand list of system analysis results.

The system status analysis module shows the CPU usage, the memory usage, the amount of the free memory, the disk activity for all disks, the disk space usage for all disks,
the total number of running processes, the total number of running threads, the number of system errors and the number of logon errors. For each system status counter, SysGauge shows
a status description which may be set to one of the following: Excellent, Good, Normal, Warning, Error or Critical.
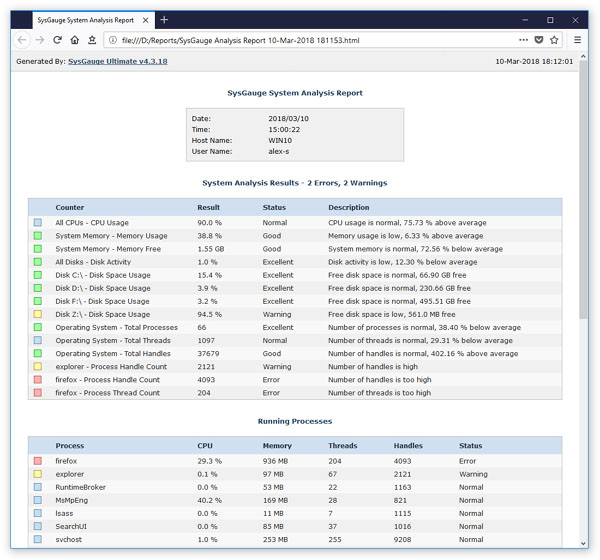
In addition, the user is provided with the ability to export the system status analysis results to the HTML, PDF, Excel, JSON and text report formats. In order to export system analysis
results to a report file, press the 'Save' button located on the system analysis results dialog, select an appropriate report format, enter a file name and press the 'Save' button.
System Analysis Charts
The system analysis results dialog allows one to display different types of charts showing the CPU usage per process, the memory usage per process, the number of threads per process
and the number of handles per process allowing one to easily identify processes using excessive amounts of the system resources.
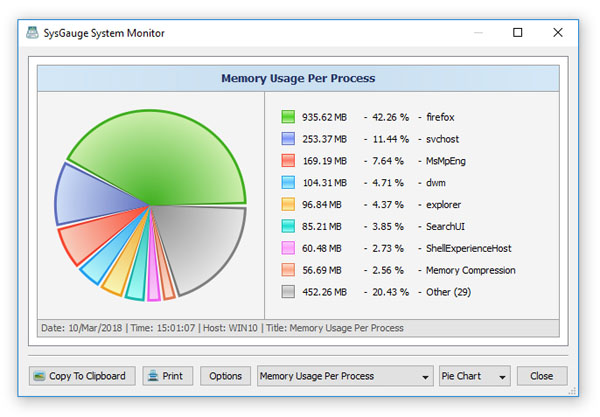
In order to open the charts dialog, press the 'Charts' button located on the system status analysis results dialog. The charts dialog allows one to display different types of charts
using the chart selector combo box, which is located on the bottom side of the charts dialog. For example, in order to display the number of threads per process, click the chart type
selector and select the 'Number of Threads Per Process' item.
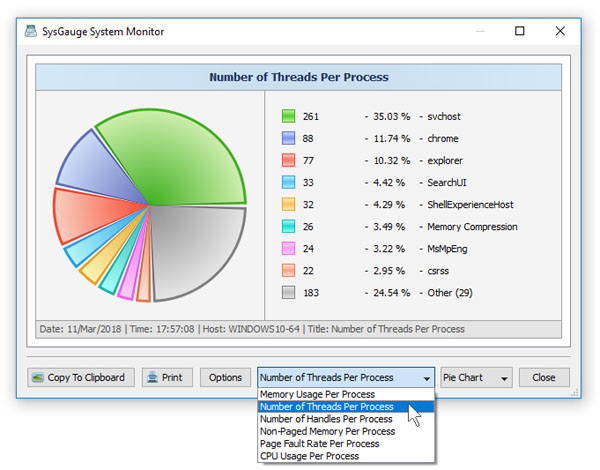
In addition, the charts dialog provides the ability to copy the currently displayed chart image to the clipboard, print the chart image, edit the chart's properties
and switch between the 'Pie Chart' and 'Bars Chart' modes.
SysGauge Command Line Utility
The SysGauge command line utility, which is available in SysGauge Ultimate and SysGauge Server product versions, provides the ability to perform the system analysis operations
and save system analysis reports from batch files and shell scripts. The command line utility is located in the SysGauge 'bin' directory and it can be used to analyze the local
or remote servers via the network. In the simplest case, open a command prompt window, go to the SysGauge 'bin' directory and type the following command:
sysgauge -analyze [ -save_pdf_report <Dir Name or File Name> ]
This command will perform a system status analysis operation and save a PDF analysis report to the specified file or directory. The system analysis report includes the system
CPU usage, memory usage, disk space usage, the operating system status and the status of all running processes.

In addition, the user is provided with the ability to save the system analysis reports to the JSON report format allowing one to import the system analysis results
to an AI platform and generate summary reports and various types of charts.